Institutional Insights: Goldman Sachs Positiong & Key Levels Update 14/4/26

Consolidated recap of GS positioning metrics
Summary
CTA Corner
We estimate that CTAs bought $19bn of US equities last week. Looking ahead, projected buying over the next week is among the largest on record. In a flat tape, we estimate CTAs could buy $43.5bn of US equities over the coming week.GS Prime Brokerage
The GS Equity Fundamental L/S Performance Estimate rose +4.01% between 4/3 and 4/9 — the strongest weekly performance since February 2021 — versus MSCI World TR +3.66%. Performance was driven by beta (+2.07%) and alpha (+1.94%), with gains on both the long and short sides.
Over the same period, the GS Equity Systematic L/S Performance Estimate rose +0.95%, driven by alpha (+0.77%) from long-side gains and beta (+0.18%).Buybacks
We estimate that 98% of corporates are currently in blackout. April is typically a lighter month for buyback activity given blackout restrictions, and we expect this window to begin reopening around April 28.Charts in Focus
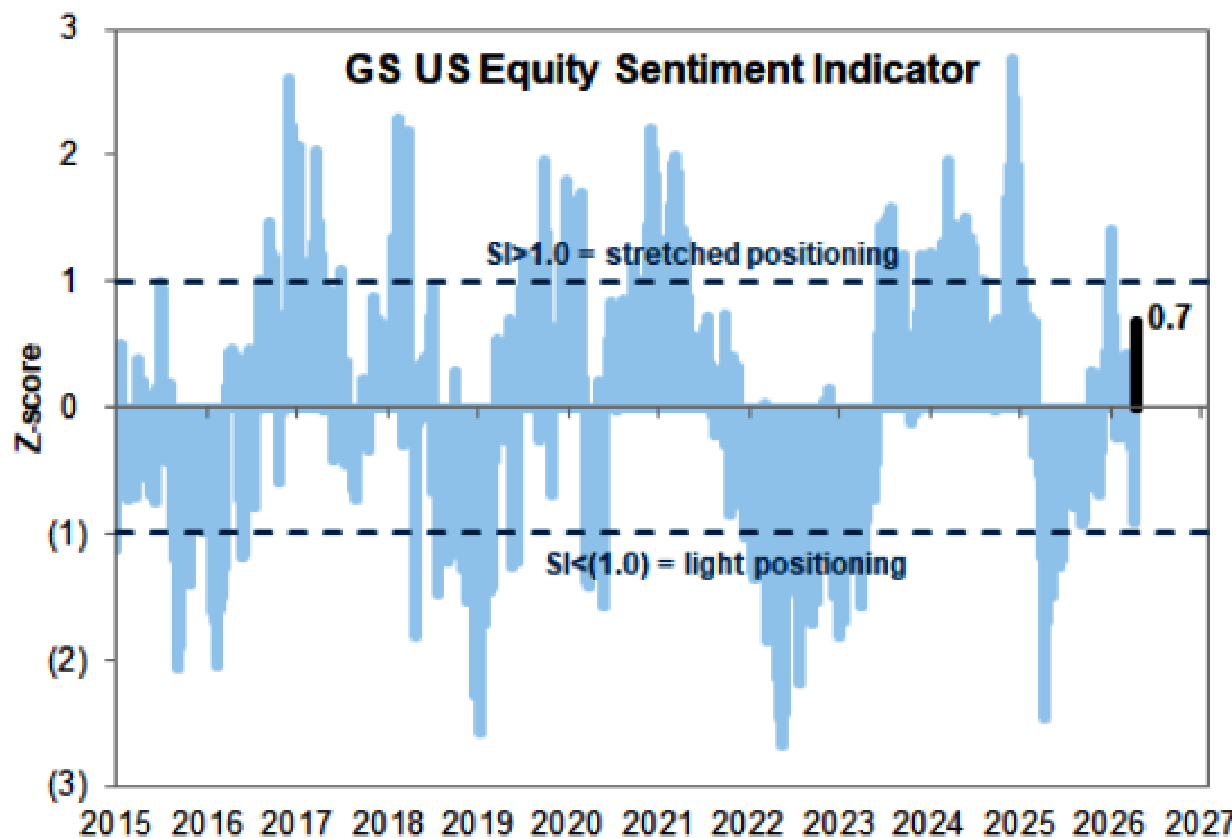
Sentiment Indicator
US Panic Index
Risk Appetite Indicator
SPX vs. Single-Stock Skew
Call Skew vs. Put Skew
S&P Futures Liquidity
Funding Spreads vs. S&P 500
CTA Corner
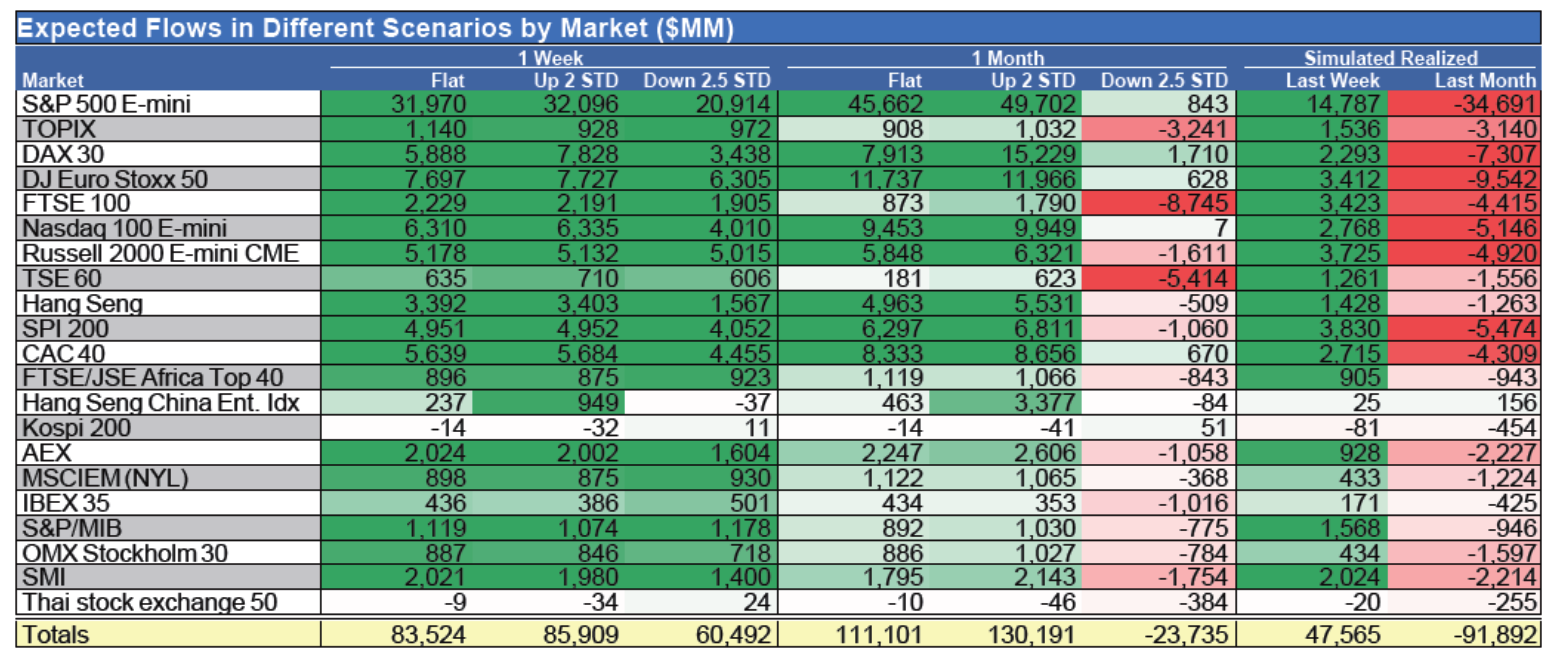
CTA Flows
Over the next 1 week
Flat tape: Buyers of $83.5bn globally, including $43.5bn into US equities
Up tape: Buyers of $85.9bn globally, including $43.6bn into US equities
Down tape: Buyers of $60.5bn globally, including $29.9bn into US equities
Over the next 1 month
Flat tape: Buyers of $111.1bn globally, including $61.0bn into US equities
Up tape: Buyers of $130.2bn globally, including $66.0bn into US equities
Down tape: Sellers of $23.7bn globally, including $761mm out of US equities
Key SPX pivot levels
Short-term: 6725
Medium-term: 6739
Long-term: 6413
Source: Goldman Sachs FICC & Equities Division Futures Strats Group, as of 13-Apr-2026
Note: A 1 standard deviation market move corresponds to approximately:
2.22% over 1 week
4.0% over 1 month
GS Prime Brokerage
Positioning / leverage
Overall book gross leverage rose +0.2 pts to 310.6% (95th percentile, 1-year)
Overall book net leverage rose +2.8 pts to 73.3% (15th percentile, 1-year)
Overall book L/S ratio rose +1.9% to 1.618 (5th percentile, 1-year)
Fundamental L/S gross leverage fell -0.4 pts to 211.7% (69th percentile, 1-year)
Fundamental L/S net leverage rose +0.4 pts to 53.5% (31st percentile, 1-year)
Flow trends
Global equities were net bought for the first time in 8 weeks (+1.2 SDs, 1-year), driven primarily by long buys and, to a lesser extent, short covers (3.6:1)
All major regions were net bought, led by EM Asia and Europe in dollar terms
Macro Products were net bought for a second straight week, driven by short covers and, to a lesser extent, long buys (3.5:1)
Single Stocks were net sold for a fourth straight week, driven by short sales outpacing long buys (2.0:1)
Sector trends
The most net sold global sectors were:
Information Technology
Industrials
Consumer Discretionary
The most net bought global sectors were:
Communication Services
Energy
Materials
Industrials ranked among the most net sold sectors globally, with selling across every major region except EM Asia, driven by both long and short selling.
US-specific observations
US equities were net bought for the first time in 8 weeks (+0.4 SDs, 1-year), driven by short covers and long buys in Macro Products, partly offset by short sales in Single Stocks
Hedge funds bought Macro Products (index + ETF combined) at the fastest pace since May 2025 (+2.2 SDs, 1-year), driven by short covers and long buys (2.4:1)
US-listed ETF shorts declined -11.5% on the week and are now down -6% MoM, marking the largest weekly percentage covering of the past decade (-3.2 z-score), led by Large Cap Equity ETFs and, to a lesser extent, Credit ETFs
Tech
US Information Technology saw the largest dollar net selling in more than five years (-2.9 SDs, 1-year), and the second-largest percentage net selling since September 2024
Selling was driven by short sales, with only modest long selling (3.3:1)
Nearly all Tech subsectors were net sold, led by Software, which accounted for roughly 60% of total dollar net selling and was driven almost entirely by short sales
Software stocks now represent just 1.4% of total US net exposure versus 7% at the start of the year
Aggregate long/short ratio in Software has fallen to 1.14, down from 2.0 at the start of the year, near the record lows seen in late February
Energy
Hedge funds bought the dip in Energy, which was the worst-performing sector this week but the most net bought in both percentage and standard deviation terms (+2.0 SDs, 1-year)
Buying was driven by long buys and short covers (1.6:1)
Nearly all Energy subsectors were net bought, led by:
Integrated
Refining & Marketing
Storage & Transportation
E&P
Energy gross/net exposures as a share of the total US Prime book are in the:
59th / 95th percentile vs. the past year
49th / 79th percentile vs. the past five years
Relative to the Russell 3000, hedge funds are now only slightly underweight Energy (-0.1%), versus a YTD low of -1.4% underweight in mid-February
That relative positioning is in the:
88th percentile vs. the past year
97th percentile vs. the past five years
Buybacks Desk
Buyback volumes remained light again this week, with blackout still in full swing across corporates. Flows finished at 0.9x vs. 2025 YTD ADTV and 1.0x vs. 2024 YTD ADTV.
We should begin to see corporates gradually exit blackout as earnings are released. The first wave of historically large repurchasers expected to report includes:
C — 4/14
JPM — 4/14
WFC — 4/14
BAC — 4/15
SCHW — 4/16
We currently estimate that 98% of corporates are in blackout. April tends to be a lighter month on the buyback desk for this reason, though we expect the blackout window to begin reopening around 4/28. Corporates typically re-enter their open window 1–2 days after earnings release.
On the authorization front, 2026 YTD buyback authorizations total $410bn, making this the most active YTD authorization period on record so far.
Disclaimer: The material provided is for information purposes only and should not be considered as investment advice. The views, information, or opinions expressed in the text belong solely to the author, and not to the author’s employer, organization, committee or other group or individual or company.
Past performance is not indicative of future results.
High Risk Warning: CFDs are complex instruments and come with a high risk of losing money rapidly due to leverage. 69% and 73% of retail investor accounts lose money when trading CFDs with Tickmill UK Ltd and Tickmill Europe Ltd respectively. You should consider whether you understand how CFDs work and whether you can afford to take the high risk of losing your money.
Futures and Options: Trading futures and options on margin carries a high degree of risk and may result in losses exceeding your initial investment. These products are not suitable for all investors. Ensure you fully understand the risks and take appropriate care to manage your risk.
Patrick has been involved in the financial markets for well over a decade as a self-educated professional trader and money manager. Flitting between the roles of market commentator, analyst and mentor, Patrick has improved the technical skills and psychological stance of literally hundreds of traders – coaching them to become savvy market operators!