Institutional Insights: Goldman Sachs SP500 Key Levels & Positioning Update 27/6/26

Equity Positioning and Key Levels: Risk Rebuilt, Buybacks Open, CTAs Quiet but Fragile
Goldman’s latest positioning dashboard shows a market where discretionary risk has been rebuilt aggressively, corporate demand is active, and systematic flows remain quiet for now but sit near important trigger levels. The headline is that the equity market is not under-owned. Hedge funds have increased leverage, tech exposure is back near extremes, buybacks are accelerating with nearly the entire S&P 500 in the open window, and mutual fund cash remains low. At the same time, CTA flow forecasts are benign in the near term but carry meaningful downside asymmetry over a one-month horizon if the tape rolls over.
The setup is constructive while spot remains firm, but increasingly sensitive to positioning, factor rotation, and key trend thresholds.
Summary of the positioning backdrop
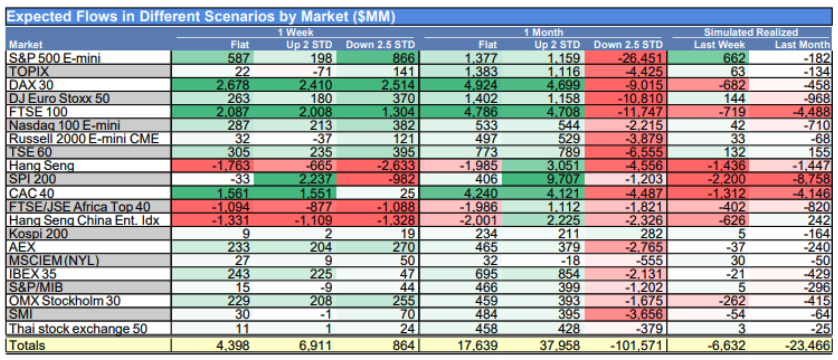
CTAs are currently estimated to be long around $90bn of global equities, having sold $6.5bn last week. Near-term systematic flow forecasts remain relatively quiet despite several trend signals sitting close to threshold levels.
Goldman’s Prime Brokerage data show a sharp rebuild in discretionary risk. The overall book gross leverage rose 2.8 points to 320.8%, a five-year high, while net leverage increased 0.3 points to 78.6%, the 60th percentile over one year. Fundamental long/short managers were especially active, with gross leverage up 5.9 points to 211.8% and net leverage up 1.8 points to 59.0%, a one-year high.
Corporate buybacks are also an important support. Goldman estimates 99% of S&P 500 corporates are in the open window as of Monday. Buyback desk activity accelerated by roughly 40% last week, with discretionary orders now representing more than 40% of total flow by order count. Goldman expects elevated activity to continue through roughly June 12.
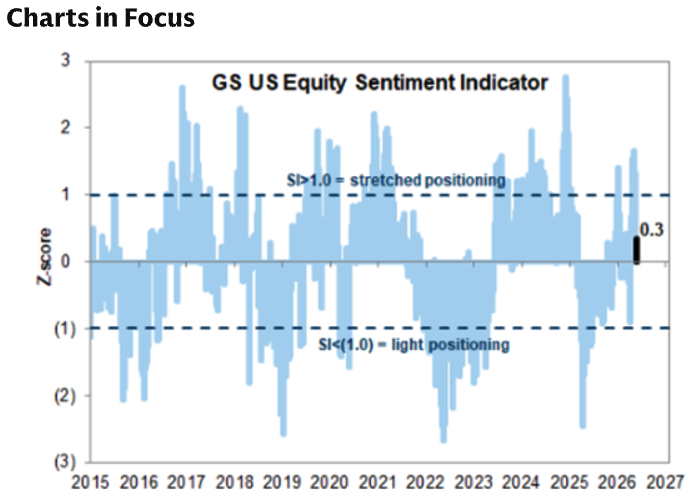
The charts in focus reinforce the same message: sentiment has improved, market breadth is being watched closely, hedge-fund and mutual-fund exposures are above average, hedge funds are record-long Semis versus underweight Software, the US Panic Index has collapsed, the Risk Appetite Indicator is high, skew and implied correlation remain important, futures liquidity is thin, and funding spreads remain a key macro watch.
CTA corner: quiet near term, asymmetric downside over one month
CTAs are estimated to be long $90bn of global equities after selling $6.5bn last week. The short-term flow picture is still relatively benign.
Over the next week, Goldman estimates CTAs would buy equities across all three tape scenarios:
Scenario | Global equity flow | US equity flow |
|---|---|---|
Flat tape | +$4.4bn to buy | +$0.9bn to buy |
Up tape | +$6.9bn to buy | +$0.4bn to buy |
Down tape | +$0.9bn to buy | +$1.4bn to buy |
That means near-term CTA activity should not be a major destabilizer. Even in a down tape over one week, the model still points to small buying.
The one-month picture is more asymmetric:
Scenario | Global equity flow | US equity flow |
|---|---|---|
Flat tape | +$17.6bn to buy | +$2.4bn to buy |
Up tape | +$38.0bn to buy | +$2.2bn to buy |
Down tape | -$101.0bn to sell | -$32.5bn to sell |
This is the key risk. CTAs are quiet unless the market breaks down. If spot remains stable or rallies, systematic flows are supportive. But if equities fall enough to breach trend thresholds, the model suggests a potentially large one-month sell program, including more than $100bn of global equity selling and $32.5bn of US equity selling.
Goldman notes that a one-standard-deviation market move is about 1.62% over one week and 3.78% over one month, so these thresholds are not extremely far away in a higher-volatility environment.
Key SPX pivot levels
The important S&P 500 trend levels are:
Horizon | SPX pivot level |
|---|---|
Short term | 7,167 |
Medium term | 6,932 |
Long term | 6,546 |
With the S&P 500 closing around 7,519, spot remains comfortably above all three pivots. The nearest key level is the short-term pivot at 7,167, roughly 4.7% below spot. A break below that area would matter because it could start to shift CTA behavior and broader trend-following signals.
Prime Brokerage: hedge funds rebuild risk, with tech back at extremes
Prime Brokerage data show that global equities were net bought by hedge funds, with activity at +0.7 standard deviations on a one-year basis. Gross trading activity continued to increase, driven by long buys outpacing short sales by 1.7-to-1.
All major regions except EM Asia were net bought, led in dollar terms by:
DM Asia
North America
Single stocks were net bought for a third consecutive week and at the fastest pace in nearly three months, also driven by long buys outpacing short sales by 1.7-to-1.
Macro products, by contrast, were net sold for a second straight week, driven by long sales outpacing short covers by 1.6-to-1. This suggests investors are adding single-name risk while trimming broader macro exposure.
Fundamental versus systematic L/S performance
Between May 15 and May 21:
GS Equity Fundamental L/S Performance Estimate fell 0.54%
MSCI World Total Return fell 0.55%
the Fundamental L/S decline was driven by -0.48% beta and -0.06% alpha
short-side losses weighed on performance
Systematic L/S performed better:
GS Equity Systematic L/S Performance Estimate rose 0.52%
gains were driven almost entirely by alpha
short-side gains were the key contributor
This is an interesting split. Fundamental managers struggled with market beta and short-side losses, while systematic managers benefited from alpha on the short side.
Leverage at highs
Overall book leverage moved higher:
Gross leverage rose 2.8 points to 320.8%, a five-year high
Net leverage rose 0.3 points to 78.6%, the 60th percentile over one year
Long/short ratio fell 0.3% to 1.649, the 12th percentile over one year
Fundamental L/S leverage also increased:
Gross leverage rose 5.9 points to 211.8%, the 68th percentile over one year
Net leverage rose 1.8 points to 59.0%, a one-year high
The message is that hedge funds are actively rebuilding gross exposure and adding single-name risk, but the long/short ratio remains relatively low, suggesting they are still carrying meaningful shorts and hedges.
Sector flows: Tech, Discretionary, and Industrials bought; Staples and Energy sold
The most net-bought global sectors were:
Info Tech
Consumer Discretionary
Industrials
The most net-sold sectors were:
Consumer Staples
Communication Services
Energy
This fits the broader risk-on, lower-oil, AI-led environment. Investors are adding exposure to growth, cyclicals, and AI infrastructure while reducing defensives and energy.
Info Tech: fastest buying since mid-March
After consistently selling US Info Tech over the previous month, led by long sales in Semis and Semi Equipment, hedge funds reversed course and net bought the sector at the fastest pace since mid-March.
The move was +1.4 standard deviations over one year.
Info Tech gross and net exposures as a share of the total US Prime book ended the week at or near five-year highs, in the 100th percentile.
This is one of the most important positioning takeaways. The market has rapidly re-embraced tech after NVDA, and exposure is now extremely crowded again.
Consumer: Discretionary bought, Staples aggressively shorted
Consumer flows diverged sharply.
Consumer Discretionary was net bought at +1.4 standard deviations over one year. After selling the sector in nine of the previous ten weeks, hedge funds bought Discretionary at the fastest pace in more than two months, driven entirely by long buys.
Consumer Staples saw the opposite pattern. It was by far the most net-sold sector and experienced the largest net selling in more than five years, as managers aggressively shorted the group.
This confirms a major rotation away from defensives and into selective cyclicals. Lower oil, lower yields, and improving risk appetite all support that shift.
Buybacks: 99% open window and activity accelerating
Corporate demand is a key support for the market.
Goldman estimates that 99% of S&P 500 index corporates are in the open window as of Monday. The buyback desk saw a decent acceleration in activity last week, with flows up roughly 40% versus the prior week.
On a YTD basis, weekly activity is tracking at:
1.6x 2025 YTD ADTV
1.8x 2024 YTD ADTV
Activity is concentrated in:
Technology
Financials
Consumer Discretionary
The desk continues to see robust demand in discretionary open-market orders, as issuers use price dislocations as opportunistic entry points. Discretionary orders now represent more than 40% of total flow by order count, which is 10 percentage points higher than the previous week.
Goldman expects this elevated buyback activity to continue through roughly June 12.
This matters because buybacks can provide a steady bid during periods of volatility, especially in large-cap quality and tech-heavy sectors.
Charts in focus: what they imply
Sentiment and risk appetite
The US Panic Index has collapsed, and the Risk Appetite Indicator remains elevated. That means investors are no longer pricing panic, but they are also not early in the risk-rebuild process. Sentiment is improving, and positioning is increasingly pro-risk.
Market breadth
Breadth remains important because the rally has been heavily concentrated in AI, semis, and Momentum. A healthier continuation would require participation to broaden into cyclicals, small caps, software, industrials, and consumer discretionary.
Hedge-fund and mutual-fund exposures
Both hedge funds and mutual funds carry above-average equity exposure. Hedge funds have rebuilt leverage aggressively, while mutual fund cash remains extremely low at 1.4% of assets, despite rising from the record low of 1.1% earlier this year.
This means there is less unused liquidity than the sentiment surveys alone might imply.
Semis versus Software
Hedge funds entered Q2 with the highest semiconductor long portfolio weight on record at 10%, while Software exposure is just 6%, the lowest since 2019.
This confirms that the AI trade is heavily expressed through semis and hardware, while software is under-owned. A rotation from AI infrastructure into AI monetization could benefit software if the narrative shifts.
Skew and implied correlation
SPX versus single-stock skew, call skew versus put skew, and S&P 500 implied correlation remain key derivatives signals. Current conditions suggest investors are paying for single-name upside while index implied correlation remains very low.
That supports strategies that monetize crowded single-stock upside while protecting against index-level correlation normalization.
Futures liquidity and funding spreads
S&P futures liquidity and funding spreads remain important. Thin futures liquidity can amplify price action around data or positioning thresholds, while funding spreads can signal stress before it appears in equities.
Trading implications
1. The market is supported while spot stays above trend pivots
CTAs are not a near-term selling risk as long as the S&P remains above key levels. The short-term pivot at 7,167 is the first important level to monitor.
2. The downside flow risk is asymmetric
One-week CTA flows are benign, but a one-month down tape could produce $101bn of global equity selling and $32.5bn of US equity selling. That makes the market vulnerable if spot breaks trend.
3. Buybacks are a powerful near-term support
With 99% of S&P 500 corporates in the open window and activity expected to remain elevated through June 12, corporate demand should help cushion dips.
4. Tech is crowded again
Info Tech gross and net exposures are at or near five-year highs. This supports momentum but increases vulnerability to profit taking.
5. Semis are the most crowded AI expression
A record 10% hedge-fund long weight in Semiconductors means the group is both a leader and a risk concentration.
6. Software is under-owned
Software exposure at the lowest level since 2019 creates potential for a catch-up trade if investors rotate from AI infrastructure toward AI monetization.
7. Consumer Discretionary is seeing a flow reversal
After weeks of selling, hedge funds are rebuilding Discretionary exposure. This aligns with lower oil, lower yields, and a de-escalation/risk-on backdrop.
8. Staples are being used as a short
The aggressive shorting of Staples shows investors are rotating away from defensives. This could work in a risk-on tape but creates squeeze risk if macro data weaken.
Disclaimer: The material provided is for information purposes only and should not be considered as investment advice. The views, information, or opinions expressed in the text belong solely to the author, and not to the author’s employer, organization, committee or other group or individual or company.
Past performance is not indicative of future results.
High Risk Warning: CFDs are complex instruments and come with a high risk of losing money rapidly due to leverage. 69% and 73% of retail investor accounts lose money when trading CFDs with Tickmill UK Ltd and Tickmill Europe Ltd respectively. You should consider whether you understand how CFDs work and whether you can afford to take the high risk of losing your money.
Futures and Options: Trading futures and options on margin carries a high degree of risk and may result in losses exceeding your initial investment. These products are not suitable for all investors. Ensure you fully understand the risks and take appropriate care to manage your risk.
Patrick has been involved in the financial markets for well over a decade as a self-educated professional trader and money manager. Flitting between the roles of market commentator, analyst and mentor, Patrick has improved the technical skills and psychological stance of literally hundreds of traders – coaching them to become savvy market operators!