S&P500 Daily Action Areas & Price Targets 10/6/26
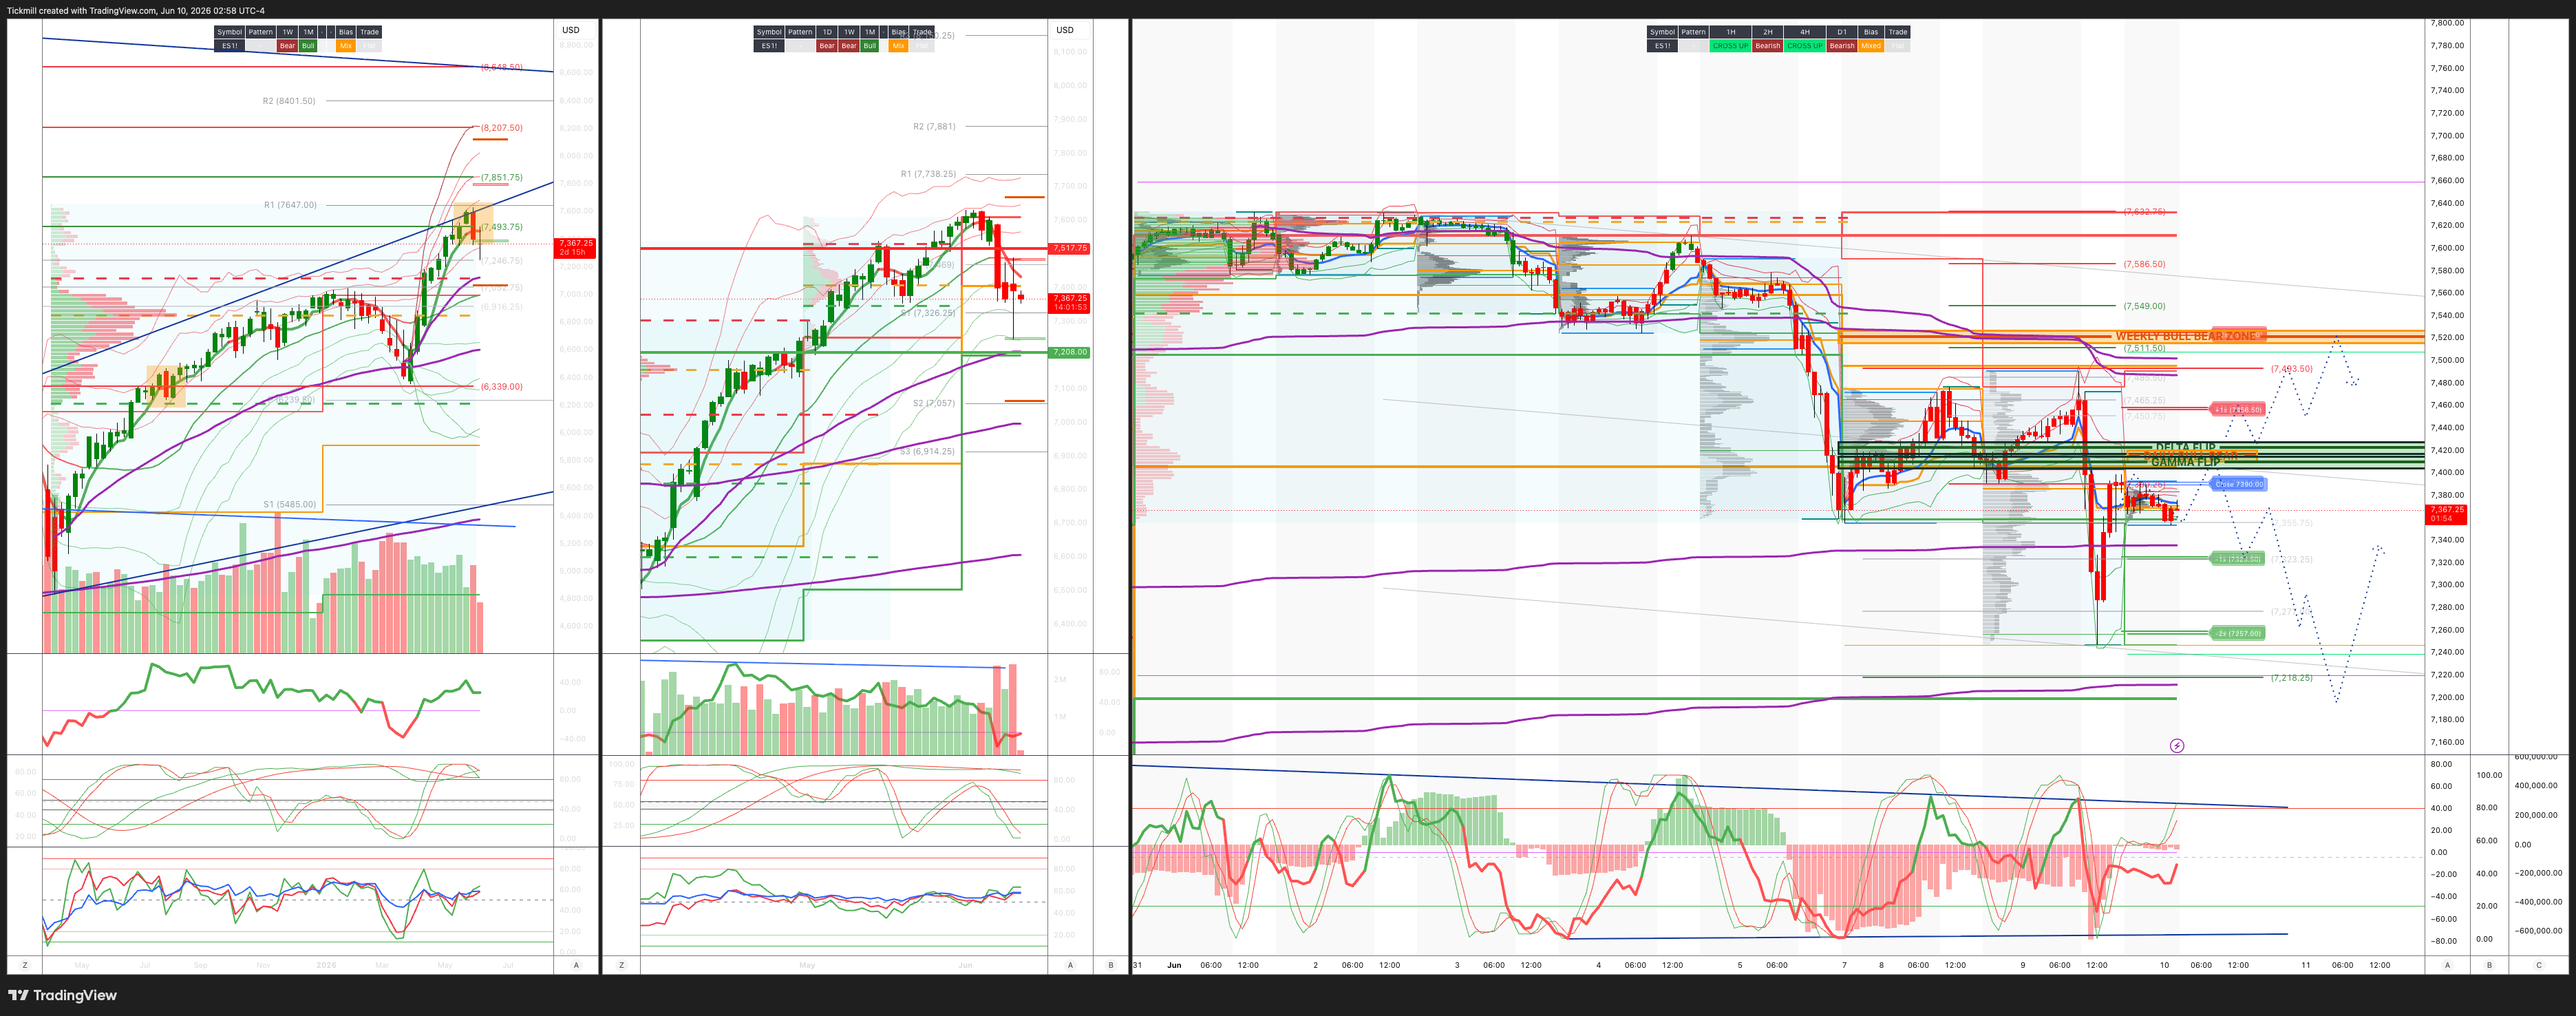
S&P500 Daily Action Areas & Price Targets 10/6/26
***QUOTING ES1! FOR CASH US500 EQUIVALENT LEVELS, SUBTRACT POINT DIFFERENCE***
WEEKLY BULL BEAR ZONE 7515/25
WEEKLY RANGE RES 7517 SUP 7208
June MOPEX Straddle: 274pt range implies a OPEX to OPEX range of [7134, 7683]
June QOPEX Straddle is 546.4pt giving us a range of [5960,7052]
JHEQX Q2 Collar 6189/6290 - 6865/6955
DEC2025 OPEX to DEC2026 OPEX is 945 points giving us a range of [5889,7779]
SPX PUT/CALL RATIO 1.25 (The numbers reflect options traded during the current session. A put-call ratio below 0.7 is generally considered bullish, and a put-call ratio above 1.0 is generally considered bearish)
DAILY VWAP BEARISH 7519
WEEKLY VWAP BEARISH 7477
MONTHLY VWAP BULLISH 7036
DAILY STRUCTURE - OTFL 7491
WEEKLY STRUCTURE - TBC
MONTHLY STRUCTURE - OTFH - 7199
Balance: This refers to a market condition where prices move within a defined range, reflecting uncertainty as participants await further market-generated information. Our approach to balance includes favouring fade trades at the range extremes (highs/lows) while preparing for potential breakout scenarios if the balance shifts.
One-Time Framing Higher (OTFH): This represents a market trend where each successive bar forms a higher low, signalling a strong and consistent upward movement.
One-Time Framing Lower (OTFL): This describes a market trend where each successive bar forms a lower high, indicating a pronounced and steady downward movement.
DAILY BULL BEAR ZONE 7420/10
GAMMA FLIP 7409
DELTA FLIP 7513
DAILY RANGE RES 7456 SUP 7322
2 SIGMA RES 7523 SUP 7257
VIX BULL BEAR ZONE 19
TRADES & TARGETS
SHORT ON REJECT/RECLAIM DAILY BULL BEAR ZONE TARGET DAILY RANGE SUP
***ADDITIONAL SETUPS & TARGETS HIGHLIGHTED ON THE CHARTS***
(I FADE TESTS OF 2 SIGMA LEVELS ESPECIALLY INTO THE FINAL HOUR OF THE NY CASH SESSION AS 90% OF THE TIME WHEN TESTED THE MARKET WILL CLOSE ABOVE OR BELOW THESE LEVELS)
GOLDMAN SACHS TRADING DESK VIEW - ‘Broadening’
US Market Wrap: Tech Weakness Continues, but Breadth Improves Under the Surface
US equities finished mixed-to-lower as another round of Tech weakness weighed on the cap-weighted indices, while breadth underneath the surface was materially better. The S&P 500 fell 26bps to 7,386, despite a very large $6.7bn MOC buy imbalance. The Nasdaq 100 fell 112bps to 9,084, the Russell 2000 slipped 3bps to 2,854, and the Dow gained 17bps to 50,872. Volumes were very elevated at 24.5bn shares across US exchanges versus the YTD daily average of 19.1bn.
Cross-asset signals were not uniformly risk-off. VIX rose 391bps to 19.64, but WTI crude fell 327bps to $88.33, the 10-year yield was essentially lower/flat at 4.52%, gold fell 163bps to 4,259, DXY slipped 8bps to 99.97, and Bitcoin fell 230bps to 62,005. The key point is that the equity pressure was not driven by a classic macro shock from higher yields or higher oil. It was primarily a continuation of the AI / high-beta / semiconductor / momentum unwind.
Tech weakness was again concentrated in semis and memory, which gave back some recent strength. The cited catalysts included a SemiAnalysis CPO note and a Crusoe data-center delay, though the desk characterized the tape as lacking a clean catalyst and trading more in a news vacuum around geopolitical headlines. That distinction matters: when crowded groups sell off on limited incremental news, it usually says more about positioning and fragility than about a single fundamental trigger.
The under-the-hood message was much better than the cap-weighted indices suggested. Breadth was positive, and the equal-weight S&P outperformed the cap-weighted S&P by roughly 1%. This is a continuation of the broadening pattern: investors are selling or trimming the largest, most crowded Tech and AI winners, while buying laggards and less crowded sectors. The index is being dragged down by mega-cap and semiconductor weakness, but the broader market is not deteriorating at the same pace.
Crude remained lower by roughly 3% despite a ceasefire walk-back and President Trump vowing to “respond” to the Apache downing. That is notable because lower crude should normally ease some stagflation and margin-pressure concerns. The fact that equities still struggled despite lower oil suggests the dominant driver was not Middle East inflation risk, but rather equity positioning and the AI/momentum unwind.
Single-stock activity was muted again, even though index volatility and intraday movement were significant. ETF activity was elevated, with ETFs representing about 34% of tape, the highest reading since March 16. That often points to more macro/factor/index-level trading rather than deep single-name fundamental engagement. In other words, investors were using baskets and ETFs to manage exposure rather than making large amounts of idiosyncratic stock-by-stock decisions.
The Nasdaq 100 intraday range was extreme. Excluding the April 2025 shock window, it was the largest NDX intraday move in the last three years, and the fourth largest on a three-year lookback overall. That is a major signal that the Tech / AI unwind is producing real instability, even if the closing index move was less dramatic than the intraday volatility suggested. The market is not showing capitulation, but it is clearly showing a positioning flush in high-beta growth.
Floor activity was low-to-moderate at 4 out of 10, which is striking given the size of the intraday NDX range and the elevated total market volume. The desk finished +319bps to buy versus a 30-day average of +29bps. Both asset managers and hedge funds finished small net buyers, with scattered demand in Health Care, Financials, and Industrials. This is another piece of evidence that the market is rotating rather than broadly liquidating. Investors are using Tech weakness to reallocate toward sectors that are less crowded and more aligned with the broadening trade.
Derivatives: Protection Demand Rises, but Not Capitulation
The derivatives tape reflected turbulence but not panic. Vol was bid across the board as the AI / high-beta momentum trade continued to let off steam after only a moderate rebound the prior day. Russell 2000 vol outperformed despite only a modest move in spot, suggesting investors are starting to pay more attention to downside or event risk in small caps as well.
Skew steepened in the belly and back end of the curve, while the front end was little changed. This implies investors are not only hedging the immediate next-day event risk; they are also reaching for protection against a continued unwind over the coming weeks and months. That fits the broader summer framework: the market may remain in an uptrend, but gaps and turbulence are becoming more likely.
Flow-wise, the desk was active in index hedge monetization and general hedging. The key language is that flows indicated a reach for protection in the event of a continued unwind and positioning flush, rather than capitulatory price action. That is an important distinction. Capitulation would involve forced selling, panic hedging at any price, and broad liquidation. This looked more like investors recognizing that the unwind may not be over and adding protection while still maintaining core risk.
On the single-name and thematic side, activity was concentrated in momentum and semis hedging, along with idiosyncratic Health Care names around the GS Healthcare Conference. That matches the cash-market story: the stress is in crowded AI/Semi/momentum, while Health Care remains a focus for rotation and stock-specific demand.
The SPX implied move for tomorrow is 0.89%, which is meaningful given the recent reset higher in VIX and the upcoming macro catalyst set. With the S&P closing at 7,386, that implies roughly a 66-point move, or an approximate one-day range of 7,320 to 7,452. Given CPI risk, ongoing Tech instability, geopolitical headlines, and elevated ETF/index trading, that implied move does not look excessive.
Disclaimer: The material provided is for information purposes only and should not be considered as investment advice. The views, information, or opinions expressed in the text belong solely to the author, and not to the author’s employer, organization, committee or other group or individual or company.
Past performance is not indicative of future results.
High Risk Warning: CFDs are complex instruments and come with a high risk of losing money rapidly due to leverage. 71% and 74% of retail investor accounts lose money when trading CFDs with Tickmill UK Ltd and Tickmill Europe Ltd respectively. You should consider whether you understand how CFDs work and whether you can afford to take the high risk of losing your money.
Futures and Options: Trading futures and options on margin carries a high degree of risk and may result in losses exceeding your initial investment. These products are not suitable for all investors. Ensure you fully understand the risks and take appropriate care to manage your risk.
Patrick has been involved in the financial markets for well over a decade as a self-educated professional trader and money manager. Flitting between the roles of market commentator, analyst and mentor, Patrick has improved the technical skills and psychological stance of literally hundreds of traders – coaching them to become savvy market operators!