S&P500 Daily Action Areas & Price Targets 30/7/26

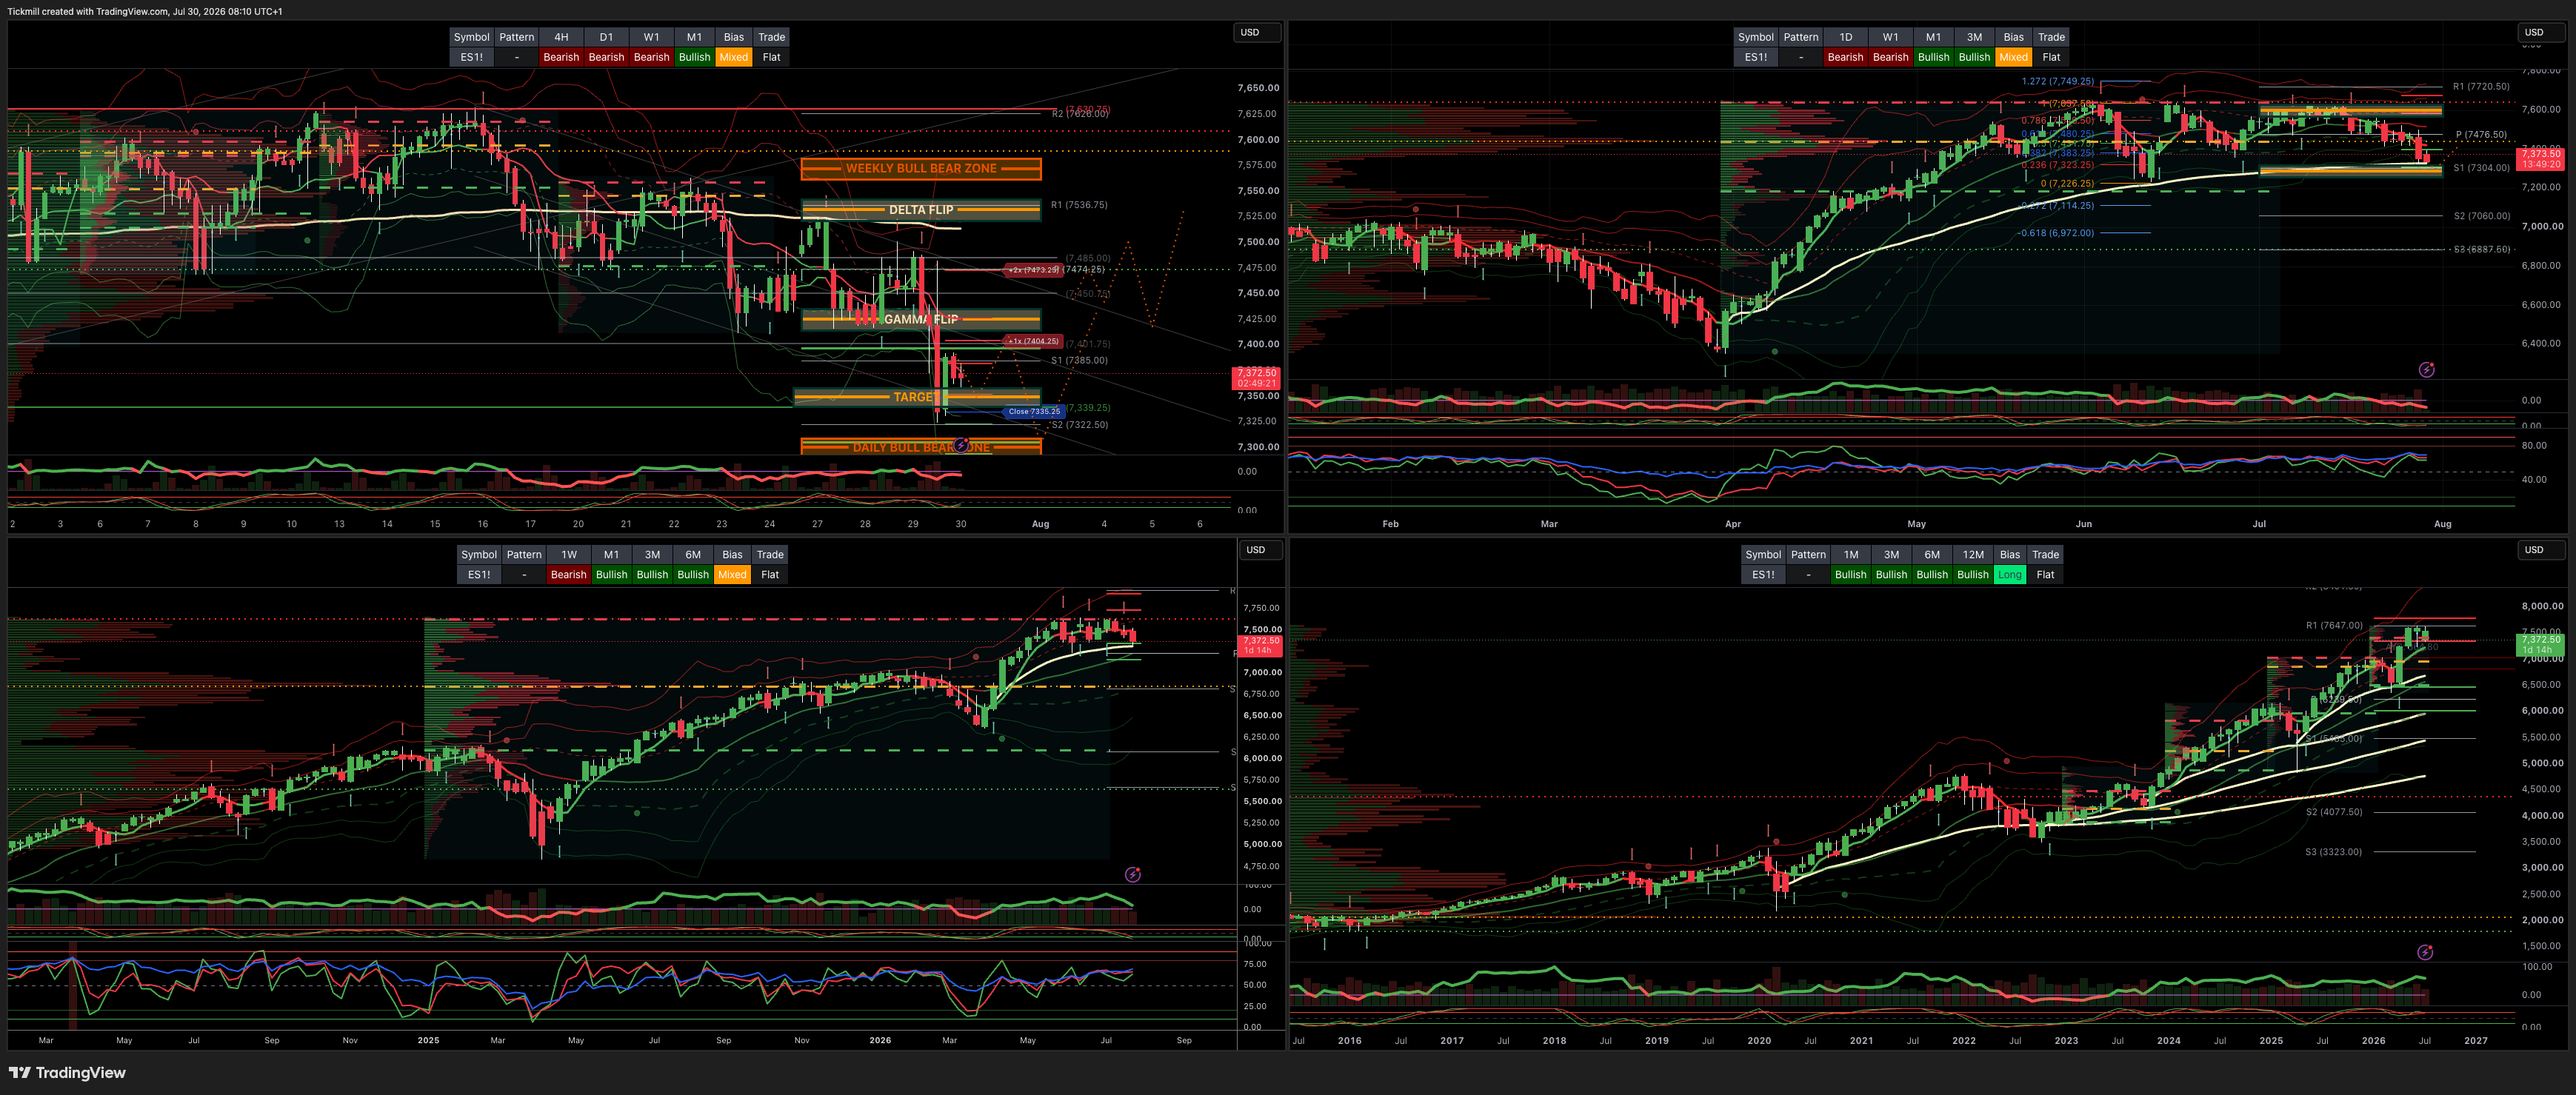
S&P500 Daily Action Areas & Price Targets 30/7/26
***QUOTING ES1! FOR CASH US500 EQUIVALENT LEVELS, SUBTRACT POINT DIFFERENCE***
WEEKLY BULL BEAR ZONE 7560/80
WEEKLY RANGE RES 7602 SUP 7301
MONTHLY RANGE RES 7838 SUP 7258
JHEQX Q3 Collar Short Call Cap: ~7,750 – 7,900 - Long Put Strike: ~7,050 – 7,100 (approx. 5% downside protection) Short Put Strike: ~5,950
DEC2025 OPEX to DEC2026 OPEX is 945 points giving us a range of [5889,7779]
SPX PUT/CALL RATIO 1.23 (The numbers reflect options traded during the current session.) A put-call ratio below 0.7 is generally considered bullish, and a put-call ratio above 1.0 is generally considered bearish.
GS Flow Desk: large S&P 31Aug 7000/7950 strangle in roughly $20mm vega / $115mm premium …My Read – classic “big convexity versus carry” trade: either someone paid a lot to own a wide August move, or someone got paid a lot to bet that the S&P stays comfortably inside the 7000–7950 corridor
DAILY VWAP BEARISH 7417
WEEKLY VWAP BEARISH 7522
MONTHLY VWAP BULLISH 7036
DAILY STRUCTURE - OTFL - 7482
WEEKLY STRUCTURE - BALANCE 7648/7247
MONTHLY STRUCTURE - OTFH - 7247
Balance: This refers to a market condition where prices move within a defined range, reflecting uncertainty as participants await further market-generated information. Our approach to balance includes favouring fade trades at the range extremes (highs/lows) while preparing for potential breakout scenarios if the balance shifts.
One-Time Framing Higher (OTFH): This represents a market trend where each successive bar forms a higher low, signalling a strong and consistent upward movement.
One-Time Framing Lower (OTFL): This describes a market trend where each successive bar forms a lower high, indicating a pronounced and steady downward movement.
DAILY BULL BEAR ZONE 7300/290
GAMMA FLIP 7533
DELTA FLIP 7456
DAILY RANGE RES 7404 SUP 7267
2 SIGMA RES 7475 SUP 7199
VIX BULL BEAR ZONE 17.9
(VVIX / VIX):5.3
TRADES & TARGETS
LONG ON REJECT/RECLAIM DAILY BEAR ZONE TARGET DAILY RANGE RES
***ADDITIONAL SETUPS & TARGETS HIGHLIGHTED ON THE CHARTS***
(I FADE TESTS OF 2 SIGMA LEVELS ESPECIALLY INTO THE FINAL HOUR OF THE NY CASH SESSION AS 90% OF THE TIME WHEN TESTED THE MARKET WILL CLOSE ABOVE OR BELOW THESE LEVELS)
GOLDMAN SACHS FICC & EQUITY TRADING DESK VIEWS
tock fell on higher FY capex and 3Q revenue guidance of US$61–64bn versus consensus US$63.14bn, with a roughly 1pt FX headwind. This is the hyperscaler-capex problem in one print: strong revenue is not enough if capex rises and investors worry about return on spend.
QCOM: -5%
F4Q EPS guide below consensus, though revenue was inline to slightly better.
HOOD: -3%
Core EPS beat, expense guide moved lower, but investors may have already marked buyside expectations above the Street due to mid-quarter updates. Forward-looking July commentary matters.
HLI: Negative
Revenue missed by roughly US$100mn, driven by corporate finance weakness and restructuring miss. Positioning was short and weakness was expected, but magnitude was worse than anticipated.
MC: Flat / Negative
Slight revenue beat, but non-comp miss limited drop-through. Recurring non-comp misses are becoming a concern.
8. The MSFT vs META Split Is the Key AI Signal
The immediate post-bell read is not simply “tech good” or “tech bad.” It is a continuation of the market’s discrimination within AI.
Company | Initial Reaction | Market Message |
|---|---|---|
MSFT | +4% | AI/cloud execution still rewarded |
META | -5% | Capex raises still punished |
LRCX | +5% | AI infrastructure / semicap demand intact |
QCOM | -5% | EPS guide downside punished |
This reinforces the existing framework:
AI enablers / bottlenecks can still outperform.
Hyperscaler capex without clear ROI can be penalized.
The market wants AI monetization, not just AI spending.
Index stabilization requires mega-cap winners to offset losers.
MSFT’s strength is helpful, but META’s weakness prevents an all-clear. If AAPL and AMZN also disappoint or fade, the index remains vulnerable. If they beat and guide constructively, the market may finally get a short-term stabilization impulse.
9. What Matters Next
The implied move for the rest of the week is 1.37%, with AAPL and AMZN still to report. From the SPX close of 7,316, that implies roughly:
7,316×0.0137=100.27,316×0.0137=100.2
So the market is pricing a rest-of-week range of approximately:
7,216 to 7,4167,216 to 7,416
That means even normal priced movement still keeps the market below the prior 7,480 pivot and below the former 7,400 support for much of the distribution.
Key Levels Now
Level | Significance |
|---|---|
7,480 | Major upside reclaim / prior pivot |
7,416 | Upper end of rest-of-week implied range |
7,400 | Broken support; now resistance |
7,372 | Prior lower implied range; now resistance |
7,316 | Current close |
7,216 | Lower end of rest-of-week implied range |
7,200 | Psychological downside level |
The first job for bulls is to reclaim 7,372 / 7,400. Without that, the market remains technically damaged.
10. Tactical Trading Framework
Equities
The setup remains fragile but increasingly two-sided. Positioning is cleaner after record de-grossing, but the macro / rates backdrop is still difficult and hyperscaler reactions are mixed.
Preferred equity stance:
Avoid broad index beta until SPX reclaims 7,372 / 7,400.
Favor relative value over outright longs.
Prefer AI enablers / semicap winners over capex-heavy hyperscalers.
Watch MSFT guidance for index stabilization potential.
Keep focus on AAPL / AMZN as the next major tape-setters.
Consider long delta / short vol structures where vol is rich and downside barriers are sensible.
Volatility
Vol was crushed after the FOMC, but the underlying tape remains unstable.
Preferred vol stance:
Monetize stale short-dated hedges after event decay.
Roll protection into later maturities if macro / earnings risk remains.
VIX above 20 keeps vol regime elevated.
If AAPL / AMZN stabilize and oil/rates calm, rich short-dated vol can bleed.
If SPX fails to reclaim 7,400, maintain downside convexity.
Rates / Macro
The steepener remains the macro focal point. The Fed did not hike, but the market is still repricing credibility / term premium.
Watch:
10Y yield around 4.70%
Oil holding above US$80
DXY behavior after the hold
Real yields
Fed communication follow-through
PCE / GDP
If rates keep rising despite the hold, equities remain vulnerable.
Disclaimer: The material provided is for information purposes only and should not be considered as investment advice. The views, information, or opinions expressed in the text belong solely to the author, and not to the author’s employer, organization, committee or other group or individual or company.
Past performance is not indicative of future results.
High Risk Warning: CFDs are complex instruments and come with a high risk of losing money rapidly due to leverage. 69% and 73% of retail investor accounts lose money when trading CFDs with Tickmill UK Ltd and Tickmill Europe Ltd respectively. You should consider whether you understand how CFDs work and whether you can afford to take the high risk of losing your money.
Futures and Options: Trading futures and options on margin carries a high degree of risk and may result in losses exceeding your initial investment. These products are not suitable for all investors. Ensure you fully understand the risks and take appropriate care to manage your risk.
Patrick has been involved in the financial markets for well over a decade as a self-educated professional trader and money manager. Flitting between the roles of market commentator, analyst and mentor, Patrick has improved the technical skills and psychological stance of literally hundreds of traders – coaching them to become savvy market operators!