S&P500 Trading Update 31/3/26

S&P500 Trading Update 31/3/26
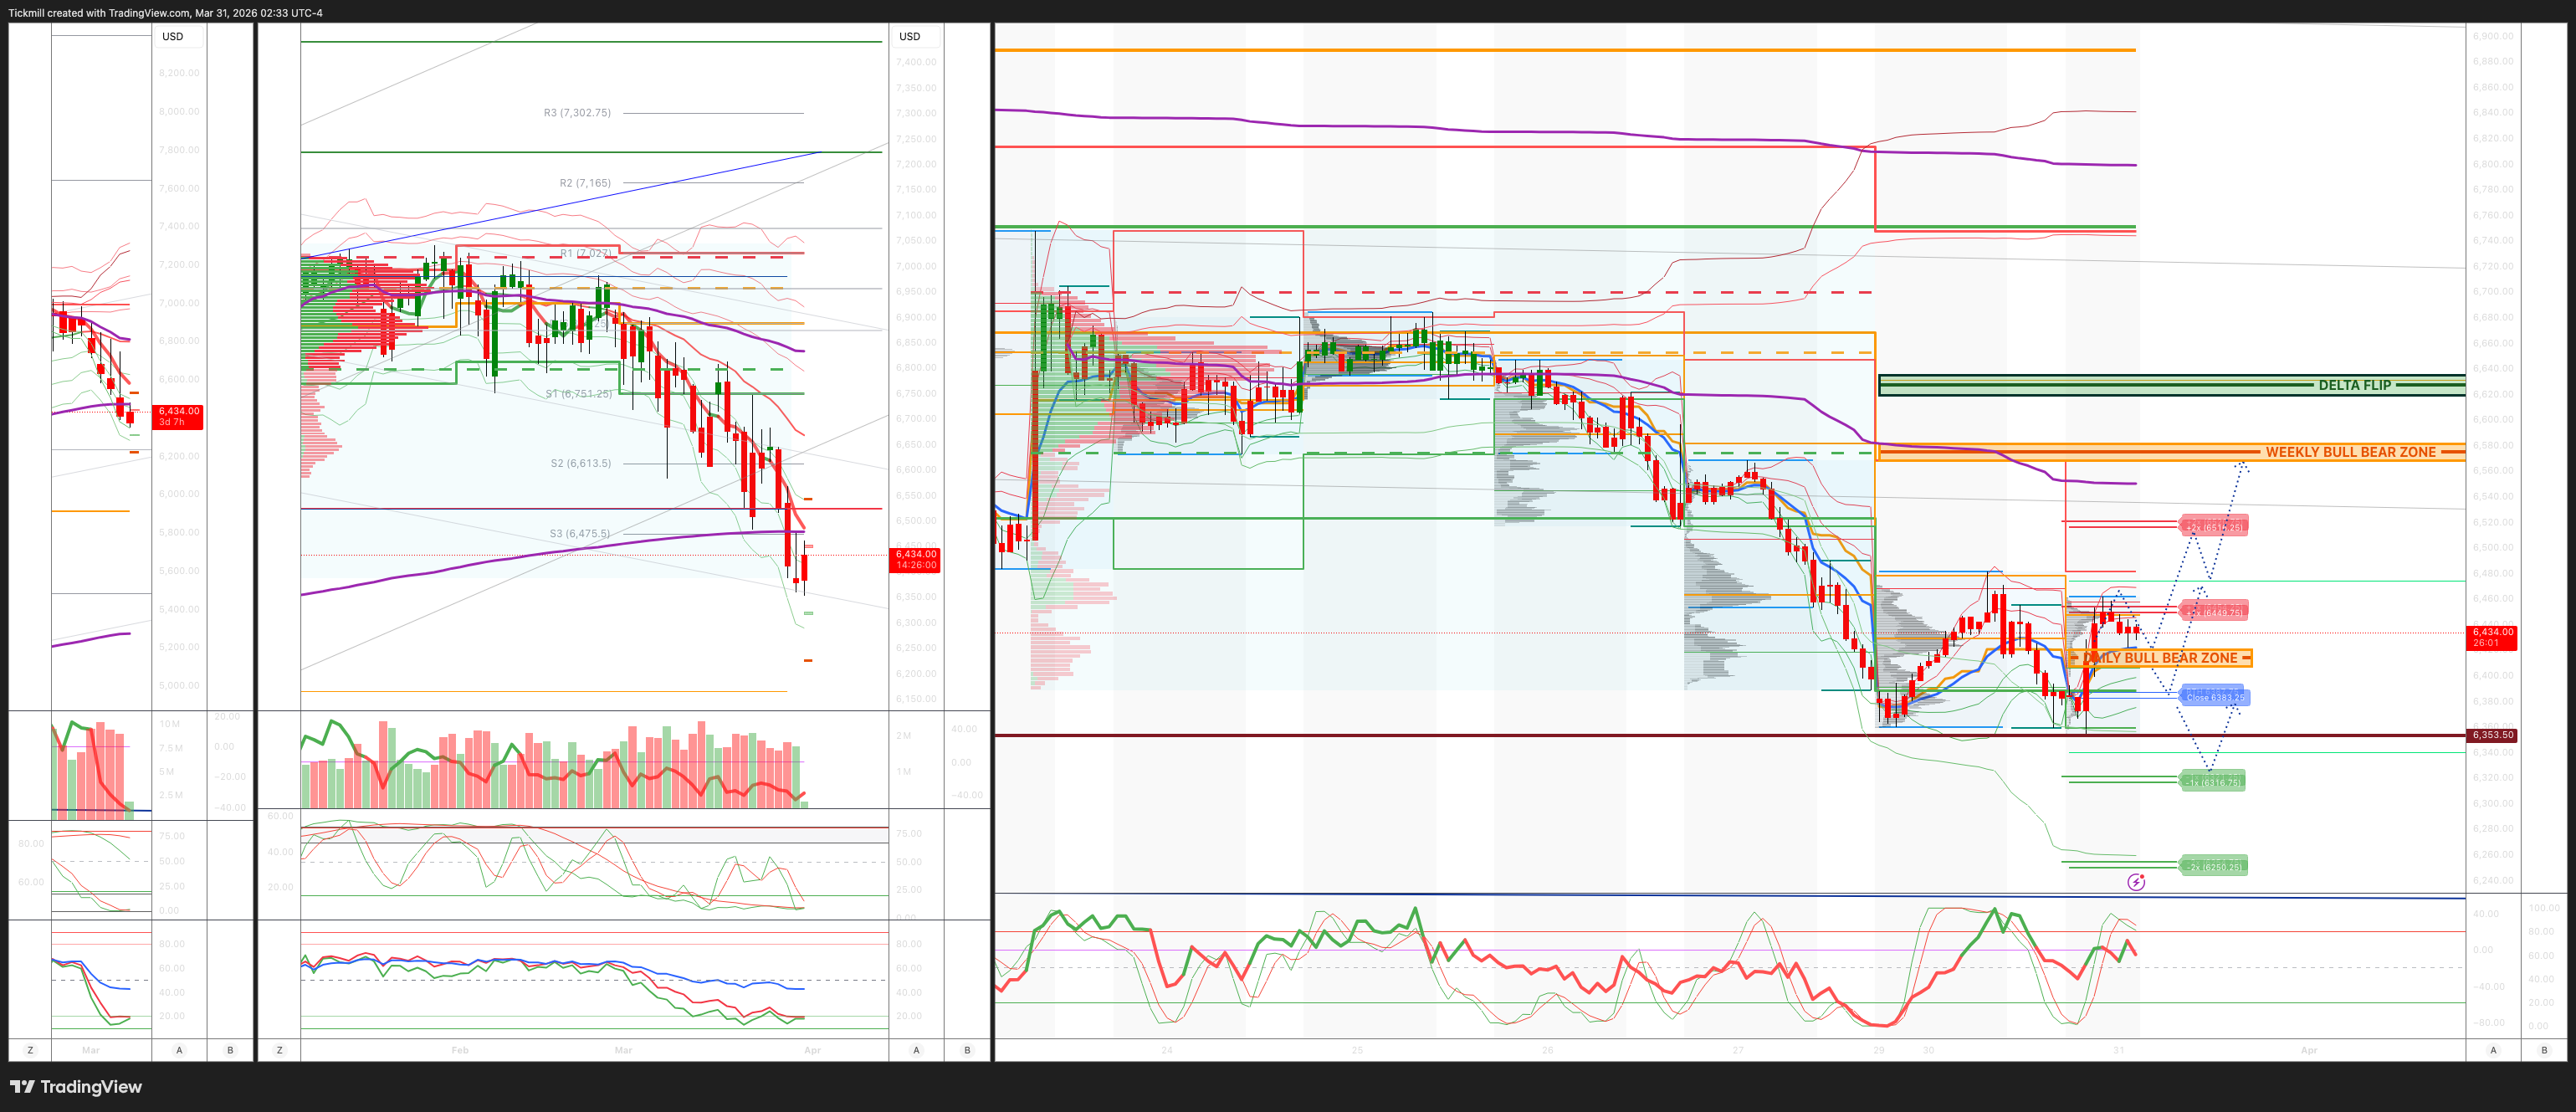
***QUOTING ES1! FOR CASH US500 EQUIVALENT LEVELS, SUBTRACT POINT DIFFERENCE***
WEEKLY BULL BEAR ZONE 6570/80
WEEKLY RANGE RES 6529 SUP 6267
April OPEX Straddle: 328.55pt range implies a OPEX to OPEX range of [6177, 6835]
June QOPEX Straddle is 546.4pt giving us a range of [5960,7052]
DEC2025 OPEX to DEC2026 OPEX is 945 points giving us a range of [5889,7779]
PUT/CALL RATIO 1.21 (The numbers reflect options traded during the current session. A put-call ratio below 0.7 is generally considered bullish, and a put-call ratio above 1.0 is generally considered bearish)
DAILY VWAP BEARISH 6487
WEEKLY VWAP BEARISH 6589
MONTHLY VWAP BEARISH 6785
DAILY STRUCTURE – OTFD - 6471
WEEKLY STRUCTURE – OTFD - 6704
MONTHLY STRUCTURE - OTFD - 6911
Balance: This refers to a market condition where prices move within a defined range, reflecting uncertainty as participants await further market-generated information. Our approach to balance includes favouring fade trades at the range extremes (highs/lows) while preparing for potential breakout scenarios if the balance shifts.
One-Time Framing Higher (OTFH): This represents a market trend where each successive bar forms a higher low, signalling a strong and consistent upward movement.
One-Time Framing Lower (OTFD): This describes a market trend where each successive bar forms a lower high, indicating a pronounced and steady downward movement.
DAILY BULL BEAR ZONE 6410/20
GAMMA FLIP 6628
DAILY RANGE RES 6454 SUP 6321
2 SIGMA RES 6695 SUP 6274
VIX BULL BEAR ZONE 22
TRADES & TARGETS
LONG ON REJECT/RECLAIM OF DAILY BULL BEAR ZONE TARGET DAILY 2 SIG RANGE RES
SHORT ON ACCEPTANCE BELOW ETH CLOSE TARGET DAILY RANGE SUP
LONG ON REJECT/RECLAIM DAILLY RANGE SUP TARGET ETH/RTH CLOSE
(I FADE TESTS OF 2 SIGMA LEVELS ESPECIALLY INTO THE FINAL HOUR OF THE NY CASH SESSION AS 90% OF THE TIME WHEN TESTED THE MARKET WILL CLOSE ABOVE OR BELOW THESE LEVELS)
GOLDMAN SACHS TRADING DESK VIEW - Mo’ Lower
S&P closed down 39bps at 6,344 with a Market-On-Close (MOC) imbalance of $270M to sell. NDX dropped 78bps to 22,954, R2K declined 146bps to 2,414, while the Dow edged up 11bps to 45,216. A total of 18.73 billion shares traded across all U.S. equity exchanges, slightly below the year-to-date daily average of 18.97 billion shares. The VIX fell 142bps to 30.61. WTI Crude surged 528bps to $104.89, the U.S. 10-year yield eased 8bps to 4.35%, gold rose 34bps to $4,509, the dollar index (DXY) gained 35bps to 100.50, and Bitcoin dipped 5bps to $66,527.
Market sentiment remained under pressure as Momentum stocks dropped sharply while crude oil prices climbed, with WTI nearing $105. GSPRHIMO experienced a significant -2.6 sigma move, marking one of its worst single-day declines in nearly five years, with a three-day loss approaching -15%, the second-largest drop since the onset of Covid. Memory stocks continued to decline, remaining central to the Long Momentum trade. Software stocks (+1%) outperformed Semiconductors (-3%) again, likely influenced by positioning and supportive commentary from banks like Goldman Sachs, which defended Security Software names such as OKTA (+3%) and CRWD (+3%) following Friday's Anthropic-driven sell-off. Elsewhere, bond yields eased after Federal Reserve Chair Powell suggested the Fed may view the recent energy price surge as a one-time event.
Activity levels on our floor were subdued, ranking 3 on a 1-10 scale. The floor ended the day down 309bps for sale versus a 30-day average of -64bps. Single-stock trading remained muted to start the week, while ETFs accounted for over 30% of total trading volume. Asset managers were net sellers of approximately $750M, with outflows concentrated in Financials, Macro Products, and TMT sectors, partially offset by demand in Energy. Hedge fund flows were more balanced, showing some demand in Staples, though overall activity was quiet. On a positive note, U.S. pensions are projected to buy $28B of U.S. equities by the end of the week, placing this estimate in the 89th percentile for buy/sell flows over the past three years and the 94th percentile since January 2000. Additionally, CTA selling pressure appears to have eased, with $85B of U.S. equities sold over the past 30 sessions. CTAs now hold a net short position of -$37B but are expected to turn buyers under all modeled scenarios over the next month.
In derivatives, it was a quiet day on the volatility desk to start the shortened week. Index flows were muted, with most activity focused on sector-specific trades, particularly in AI-related names. Over the weekend, the S&P 1-month put-call skew flattened significantly following Friday's session. Thursday and Friday saw one of the sharpest two-day compression events in the past two years, a trend that continued into today, especially in the front end. Dealers remain significantly short gamma, with one of the steepest session-to-session declines (~$7B short). Client sentiment remains cautious, and we expect this trend to persist until further macroeconomic clarity emerges. The month-end straddle closed at ~1.09%.
Disclaimer: The material provided is for information purposes only and should not be considered as investment advice. The views, information, or opinions expressed in the text belong solely to the author, and not to the author’s employer, organization, committee or other group or individual or company.
Past performance is not indicative of future results.
High Risk Warning: CFDs are complex instruments and come with a high risk of losing money rapidly due to leverage. 69% and 73% of retail investor accounts lose money when trading CFDs with Tickmill UK Ltd and Tickmill Europe Ltd respectively. You should consider whether you understand how CFDs work and whether you can afford to take the high risk of losing your money.
Futures and Options: Trading futures and options on margin carries a high degree of risk and may result in losses exceeding your initial investment. These products are not suitable for all investors. Ensure you fully understand the risks and take appropriate care to manage your risk.
Patrick has been involved in the financial markets for well over a decade as a self-educated professional trader and money manager. Flitting between the roles of market commentator, analyst and mentor, Patrick has improved the technical skills and psychological stance of literally hundreds of traders – coaching them to become savvy market operators!