S&P500 Trading Update 13/4/26

S&P500 Trading Update 13/4/26
***QUOTING ES1! FOR CASH US500 EQUIVALENT LEVELS, SUBTRACT POINT DIFFERENCE***
WEEKLY BULL BEAR ZONE 6730/20
WEEKLY RANGE RES 6745/35 SUP 6955/75
April OPEX Straddle: 328.55pt range implies a OPEX to OPEX range of [6177, 6835]
June QOPEX Straddle is 546.4pt giving us a range of [5960,7052]
JHEQX Q2 Collar 6189/6290 - 6865/6955
DEC2025 OPEX to DEC2026 OPEX is 945 points giving us a range of [5889,7779]
SPX PUT/CALL RATIO 1.17 (The numbers reflect options traded during the current session. A put-call ratio below 0.7 is generally considered bullish, and a put-call ratio above 1.0 is generally considered bearish)
DAILY VWAP BULLISH 6756
WEEKLY VWAP BULLISH 6591
MONTHLY VWAP BULLISH 6816
DAILY STRUCTURE – OTFH - 6846
WEEKLY STRUCTURE – BALANCE - 6911/6359
MONTHLY STRUCTURE - OTFD - 6911
Balance: This refers to a market condition where prices move within a defined range, reflecting uncertainty as participants await further market-generated information. Our approach to balance includes favouring fade trades at the range extremes (highs/lows) while preparing for potential breakout scenarios if the balance shifts.
One-Time Framing Higher (OTFH): This represents a market trend where each successive bar forms a higher low, signalling a strong and consistent upward movement.
One-Time Framing Down (OTFD): This describes a market trend where each successive bar forms a lower high, indicating a pronounced and steady downward movement.
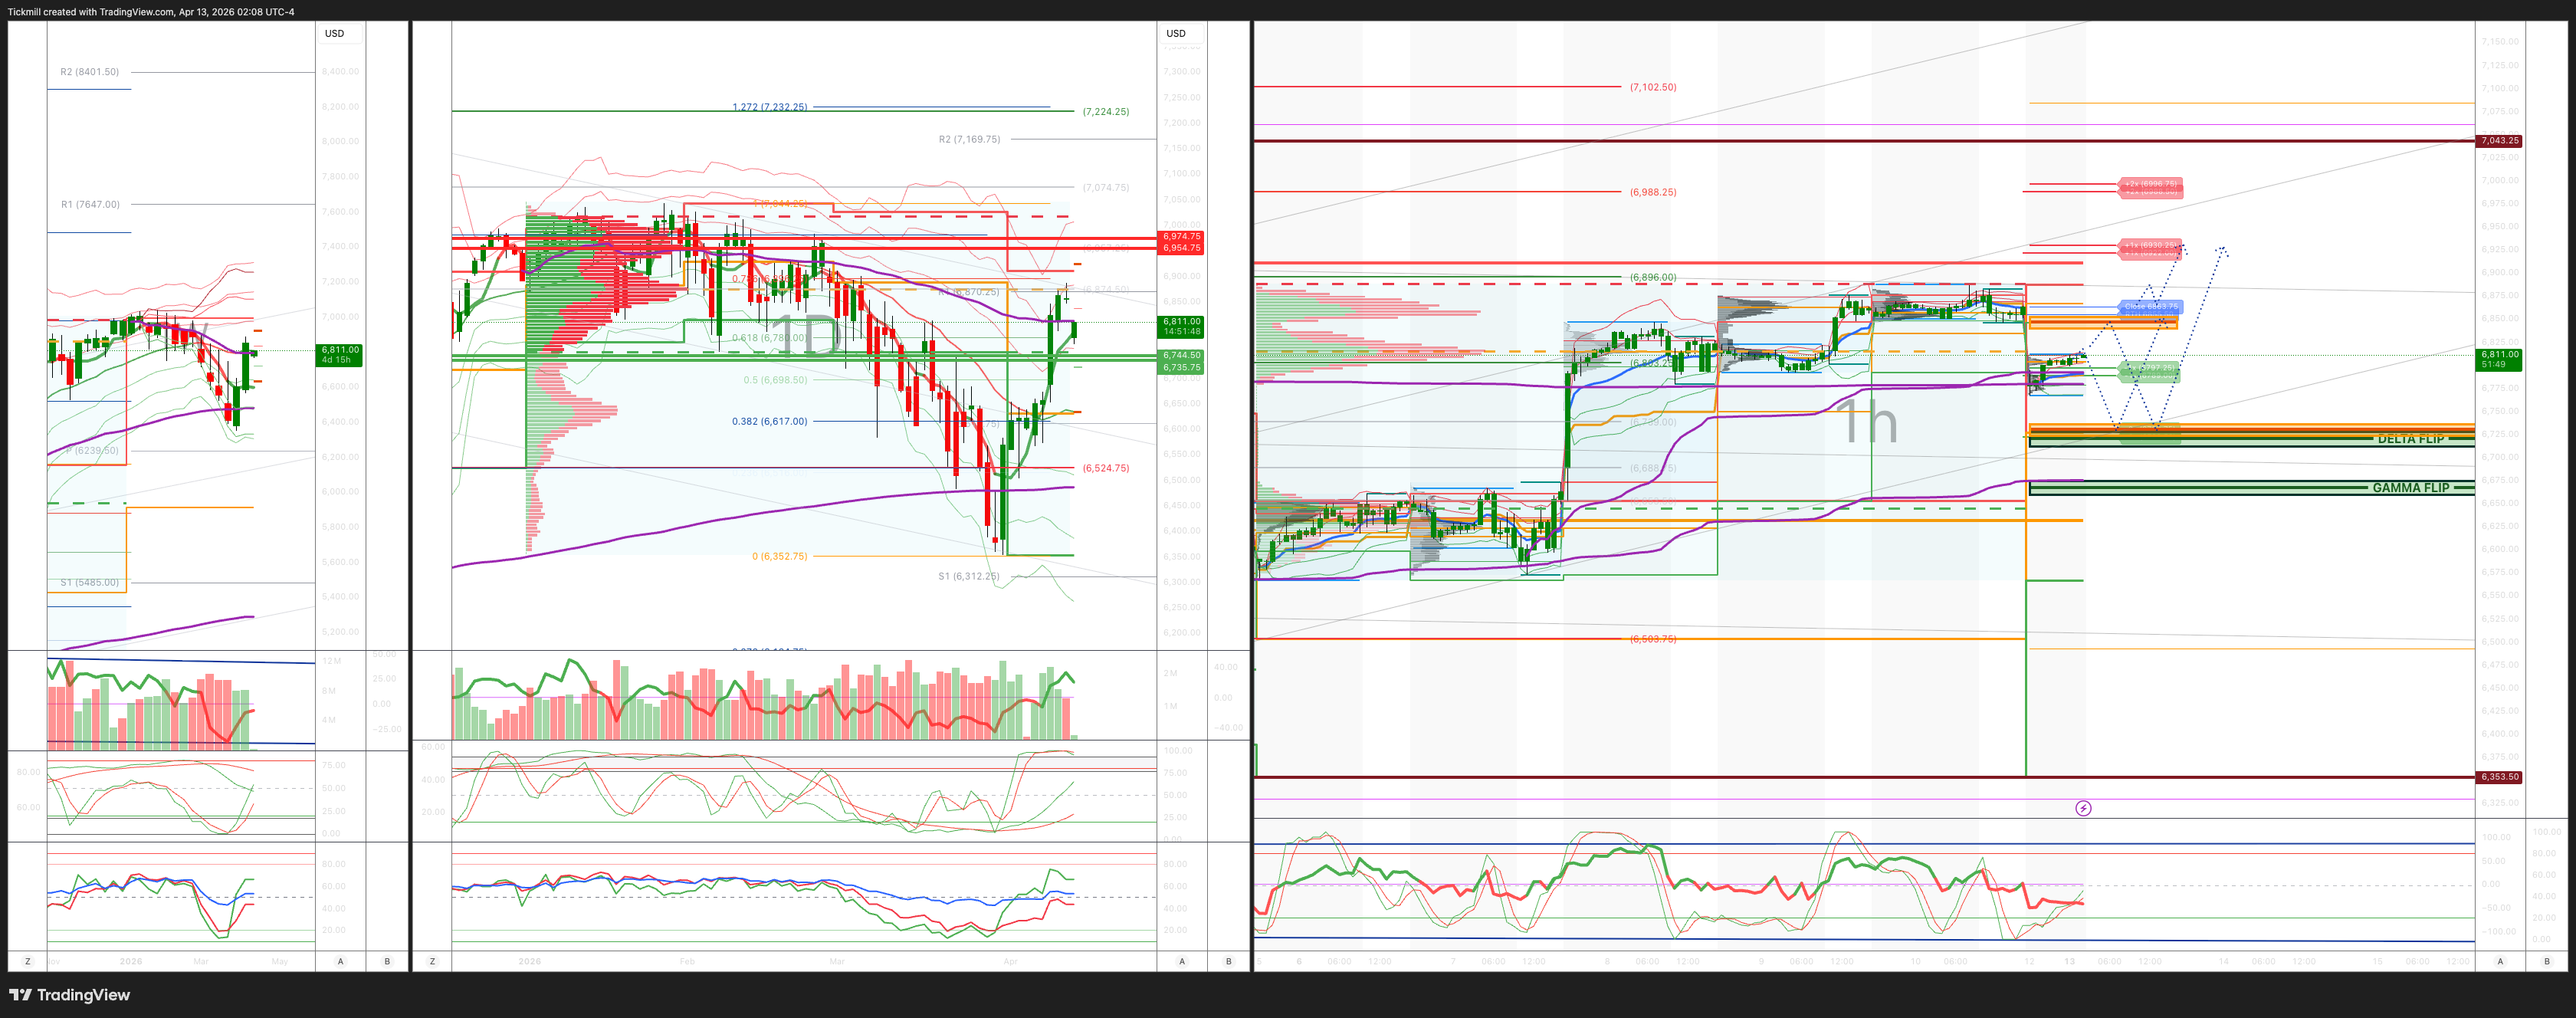
DAILY BULL BEAR ZONE 6845/55
GAMMA FLIP 6638
DAILY RANGE RES 6922 SUP 6789
2 SIGMA RES 6988 SUP 6722
VIX BULL BEAR ZONE 22
TRADES & TARGETS
SHORT ON REJECT/RECLAIM OF DAILY BULL BEAR ZONE TARGET WEEKLY BULL BEAR ZONE
***ADDITIONAL SETUPS & TARGETS HIGHLIGHTED ON THE CHARTS***
(I FADE TESTS OF 2 SIGMA LEVELS ESPECIALLY INTO THE FINAL HOUR OF THE NY CASH SESSION AS 90% OF THE TIME WHEN TESTED THE MARKET WILL CLOSE ABOVE OR BELOW THESE LEVELS)
GOLDMAN SACHS TRADING DESK VIEW - ‘Weekend Thoughts’
2026 is a trading environment unlike any other — Jim Nantz, if he covered markets instead of green jackets.
1/ Equity beta comes back from the brink
2/ Geopolitical clarity drives a meaningful risk-on rotation
3/ CTA-related questions likely hit all-time highs tomorrow
4/ If the first-order moves are already priced, the key question becomes: where are the next pockets of opportunity?
Consensus: if you liked it before the conflict, you are going to love it now.
Good luck.
1/ A terrible month meets an exceptional week
Think escalator down, elevator up — and a reminder of why vol skew can feel “broken” in the academic sense.
• March 2026 saw long/short hedge funds decline -5%, their worst month in four years
• Last week (Apr 6–10) saw long/short hedge funds rise +4.4%, their best weekly performance in five years and a top-five weekly gain of the last decade
• The fear of the right tail across our client base was well founded and ultimately correct. Few owned it through convexity; most managed exposure through linear expressions
• Fun fact: there have been more daily S&P 500 rallies of >250 bps in the last two weeks than there have been >250 bps daily selloffs in the last year
• In this tape, single-session rallies are sharper than single-session declines
2/ Hedge fund positioning: geopolitical clarity encourages offense
• The global prime brokerage book was net bought for the first time in eight weeks, driven by both long buying and short covering at a 1.4-to-1 ratio — a clear risk-on signal
• The U.S. prime brokerage book saw macro product and ETF short covering at the fastest pace of the last decade — also risk-on
• The global prime brokerage book also saw significant net selling in single stocks this week, at 1.8 standard deviations, driven by short sales — another sign of active repositioning
• U.S. long/short gross exposure stands at 211.9, in the 77th percentile on a three-year lookback
• Net exposure stands at 51.6, only the 21st percentile on a three-year lookback
3/ Systematic positioning: slow-moving strategies may still have significant demand to cover
Data as of Thursday night; next update tomorrow at 8:00 a.m.
• It is a green sweep, with nearly every scenario pointing to meaningful CTA buying
• Over the last month, this cohort sold $115 billion of global equities
• Over the next month, assuming a flat tape, they are expected to buy back all of that and more, with projected demand of +$119.5 billion
• The demand is most concentrated in U.S. index products, with nearly $70 billion of aggregate buying expected across SPX (+$52 billion), NDX (+$10.4 billion), and RTY (+$6.1 billion) over the next month in a flat market
• SPX now sits above the short-term threshold (6720), medium-term threshold (6738), and long-term threshold (6410) for the first time since January
4/ If first-order trades are already priced, where are the next pockets of opportunity?
• Software
The semiconductor versus software basket hit an all-time low on Friday, with the pair trade down 22% last week alone. There may be real opportunity emerging from the wreckage. As P. Callahan noted this morning, two names stand out: NOW trades just below 9x GIR estimated potential GAAP EPS, while the implied valuation of MSFT M365 commercial/consumer sits at 4x EV / 2027 GAAP EBIT. This does not feel like a “buy the basket” setup — it feels like a single-stock picker’s market
• Non-U.S. equities
KOSPI was one of the market’s favorite longs heading into the conflict and still sits 7% below late-February levels — likely worth revisiting. Japan and Brazil also continue to offer strong fundamental backdrops and positive catalyst paths ahead, and we remain constructive there
• U.S. single names into earnings
Earnings season begins this week, with 8% of the S&P 500 reporting this week, 24% next week, and 36% the week after. Ben Snider and team stayed firm on earnings expectations even at the lows, with a base case of +12% EPS growth in 2026. Goldman Sachs is overweight Materials and Healthcare into Q1 prints and updated its conviction list as of April 1
• Rates
A negotiated resolution reduces the tail risk of higher commodity prices feeding into inflation. While the bar for rate cuts remains extremely high, the move in shorter-dated rates likely looks done for now. Lower-yield trades have worked — 1y1y
Disclaimer: The material provided is for information purposes only and should not be considered as investment advice. The views, information, or opinions expressed in the text belong solely to the author, and not to the author’s employer, organization, committee or other group or individual or company.
Past performance is not indicative of future results.
High Risk Warning: CFDs are complex instruments and come with a high risk of losing money rapidly due to leverage. 69% and 73% of retail investor accounts lose money when trading CFDs with Tickmill UK Ltd and Tickmill Europe Ltd respectively. You should consider whether you understand how CFDs work and whether you can afford to take the high risk of losing your money.
Futures and Options: Trading futures and options on margin carries a high degree of risk and may result in losses exceeding your initial investment. These products are not suitable for all investors. Ensure you fully understand the risks and take appropriate care to manage your risk.
Patrick has been involved in the financial markets for well over a decade as a self-educated professional trader and money manager. Flitting between the roles of market commentator, analyst and mentor, Patrick has improved the technical skills and psychological stance of literally hundreds of traders – coaching them to become savvy market operators!